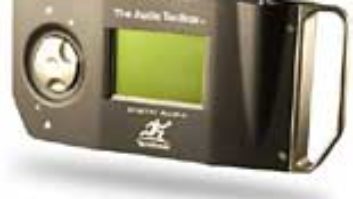
I bought my first piece of test equipment in 1975 — a Micronta volt-ohm meter from the local Radio Shack. I assumed its manual would teach me to fix stuff, but the tiny pamphlet left me none the wiser in the ways of electronics. You might have the same experience today with the Terrasonde Audio Toolbox. It packs a fantastic assortment of acoustic and electronic measurement capability into a handy package, but, alas, it won’t transform you into an acoustician any more than my $20 VOM turned me into an electronics whiz.
Analyzers give you data depending on the questions you ask. It’s up to you to formulate your questions and then interpret the results. So, when you get your hands on this spiffy little box, think before you measure — especially when loudspeakers and microphones are involved!
REMEMBER TO REMEMBER
The Audio Toolbox has a lot of adjustable parameters tucked within its various screens, but these reset to their default values when the unit is power-cycled. Fortunately, there is a way to save all settings in nonvolatile memory.
In the Utility Functions page, select “Setup & Calibration.” Under “Save Defaults,” scroll the knob to “Store Settings Save” and click. Now all your settings — such as sweep-generator output level, start/stop frequencies and sweep duration — will be waiting for you the next time you’re ready to work. By the way, Toolbox software Version 3.0 saves a more complete list of parameters than Version 2.5.
PLUG-IN ANALYSIS
Higher-end analyzers (such as the TEF) make swept-frequency measurements through a narrow-band input filter that tracks the sweep-generator frequency. The Toolbox doesn’t have this feature; however, I found a case in which the Toolbox’s lack of an input filter made it possible to make a DAW measurement that otherwise would have been difficult. I generated a 10-second tone on one of my DAWs and then made several EQ’d variations with different plug-ins. I then played these EQ’d tones into the Toolbox. I wanted to see how closely each plug-in’s response matched its GUI curve and how closely they matched each other with ostensibly identical settings. When performing these asynchronous sweeps, make sure that the Toolbox’s sweep settings match the DAW’s test tone and start them together. Toolbox users with the upgraded contractor’s software could use the 1/12-octave RTA and a pink-noise test tone and avoid the manual sync required by the previous example.
ACOUSTIC MEASUREMENTS ON A BUDGET
Making an absolute measurement of a microphone or a loudspeaker traditionally requires a reflection-free, anechoic environment. However, I’ve had some luck performing relative measurements under less controlled conditions. For example, I wanted to compare the frequency response of a pair of budget condenser mics. I placed the first mic and speaker 16 inches apart on an open garage floor to minimize floor reflections. After plugging the mic into the Toolbox, I ran a couple of sweeps and saved the results. I then repeated the same test with the second mic, making sure that the placements were identical in both tests. The resulting curves were anything but flat, but that’s okay; it’s the difference between measurements that’s of interest. As you can see from the plot, the mics measured within 1 dB.
OLD TRICKS, GNUPLOTS
Speaking of plots, here’s another tip: The results of many Toolbox tests can be downloaded to a Mac or PC as ASCII text files. Although many users graph the results in Microsoft Excel, I prefer using GNUPlot, a free software program available for Mac, Windows and many other platforms. Visit www.gnuplot.info for downloads, FAQs and more information.
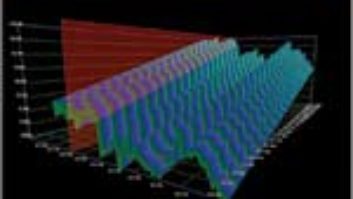
You can use GNUPlot to generate raw or smoothed frequency-response curves, impulse responses from Energy-Time Graph measurements or bar charts from RTAs. Visit my Website at www.trubitt.com and follow the “Toolbox Tips” link for GNUPlot examples and a template to get you started.
Rudy and Robin Boyce-Trubitt have a new baby girl!


